Understanding Model Metrics
Models are essentially prediction engines, or weighted algorithms that are designed to predict a future value given a set of input values. When a model is being trained, data from the Training pool is being used to train the model along with a set of weights which can be tuned to help the model with its predictions. For each step in training, data from the Testing pool is used to measure the cumulative model’s ability to make predictions. Loss functions are used to determine how far the predicted values of the model deviate from the actual values in the Testing data; this deviation is known as “Loss”. Optimization functions use the loss to help adjust model weights between each training step to minimize that loss, so that each step the model prediction is closer to the actual data. This is, in effect, what training is all about.
Each training checkpoint (100 training steps), model metrics are saved – among these metrics include the loss values for various properties of the model. Metrics can be analyzed to get a general sense for how model training is going, and whether or not the model is reaching convergence (reaching the point where additional training yields little to no benefits). Several of these metrics are described below:
Training Metrics (metrics taken as the model is being trained)
learning_rate – The learning_rate refers to the average update rate at which the model’s weights are changing in order to fit the data. Really small values means the model will take a long time to adjust the weights to fit the prediction to the data, and really large values means the model might overshoot as it’s trying to adjust the weights. ftc-ml ramps up the learning rate and then lowers the learning rate over the course of the model training in a process known as “warm-up”, which helps combat training bias in datasets when a portion of the early training data might cause the model to skew toward undesired training features based on related commonalities.
Loss/classification_loss – This is the loss for the classification of detected objects into various classes (Labels), such as Block, Ball, Duck, etc. During training, this graph should trend downward as the classification improves. Values closer to zero are better.
Loss/localization_loss – This is the loss for the bounding box regressor, which is the function for determining the bounding box for detected objects. This graph should trend downward as the prediction for the bounding box moves closer to the labeled bounding boxes. Values closer to zero are better.
Loss/regularization_loss – This is the loss for a larger set of “global” optimization metrics that help drive the model in desired directions. Since parameter tweaks aren’t available to users in ftc-ml, this metric is generally meaningless for analyzing model behavior during training.
Loss/total_loss – This is an overall summary of the loss metrics for the model as a whole. Values closer to zero are better.
steps_per_sec – This shows the average model training speed at each checkpoint.
Evaluation Metrics (metrics taken as the model is being tested/evaluated)
DetectionBoxes_Precision/mAP – This is the “mean average precision”, which is an overall precision of detection/classification across all frames, labels, and bounding box thresholds and taking the average. This gives a view of how well the model is generally performing; values closer to 1.0 are better.
DetectionBoxes_Precision/mAP (large, medium, small) – This filters and separates the mAP metrics into three buckets based on the average pixel size of the detected objects and bounding boxes with respect to the model size. Values of -1 indicate that no objects met the size constraints for that bucket.
DetectionBoxes_Precision/mAP(@.50IOU, @.75IOU) – IOU stands for “Intersection Over Union”, also referred to as the Jaccard index, and is essentially a statistic used for gauging the similarity and diversity of sample sets. Normally an IOU >.50 is considered a good prediction, and >.75 is considered a really good prediction. These metrics are the average precision using only the specified IOU (but still going over all frames and labels). The idea of this metric is to give you a rough sense of accuracy of object detection if you are not super strict about the position of your bounding boxes. For example, in the .50IOU case, you would see model accuracy over all frames and labels if we “only somewhat” care about bounding box accuracy. However, at .75IOU the bounding box accuracy is taken more seriously, so model accuracy is often less with higher values of IOU. Values closer to 1.0 are better.
DetectionBoxes_Recall/AR(@1, @10, @100) – These are “mean average recalls”, or a metric for specifically measuring object detection performance, bucketed by the maximum number of detections within the image (objects with only one detection would be in the @1 bucket, objects with at most 10 detections would be in the @10 bucket, and so on). The Recall metric is a metric that compares “true data” with “predicted data”, and provides an indication of the number of misdetections. A value of 1.0 means “all perfect detections”, and the more “misdetections” in the model the closer the value is to zero.
DetectionBoxes_Recall/AR@100(large, medium, small) – these are average recalls bucketed by the size of the detected bounding box. Notice the AR@100 in the metric – this means only images with at most 100 detections are used (typically this will mean all images for fml-tc). Buckets are equal to that of the /mAP metric above. Values of -1 indicate that no objects met the size constraints for that bucket.
Loss/classification_loss – Same as Loss/classification_loss in Training Metrics, except this is for the Evaluation/Testing data.
Loss/localization_loss – Same as Loss/localization_loss in Training Metrics, except this is for the Evaluation/Testing data.
Loss/regularization_loss – Same as Loss/regularization_loss in Training Metrics, except this is for the Evaluation/Testing data.
Loss/total_loss – Same as Loss/total_loss in Training Metrics, except this is for the Evaluation/Testing data.
To view model metrics, click on the Description link for the model in the Models tab you wish to view. This will open the “Monitor Training” viewer for that model.
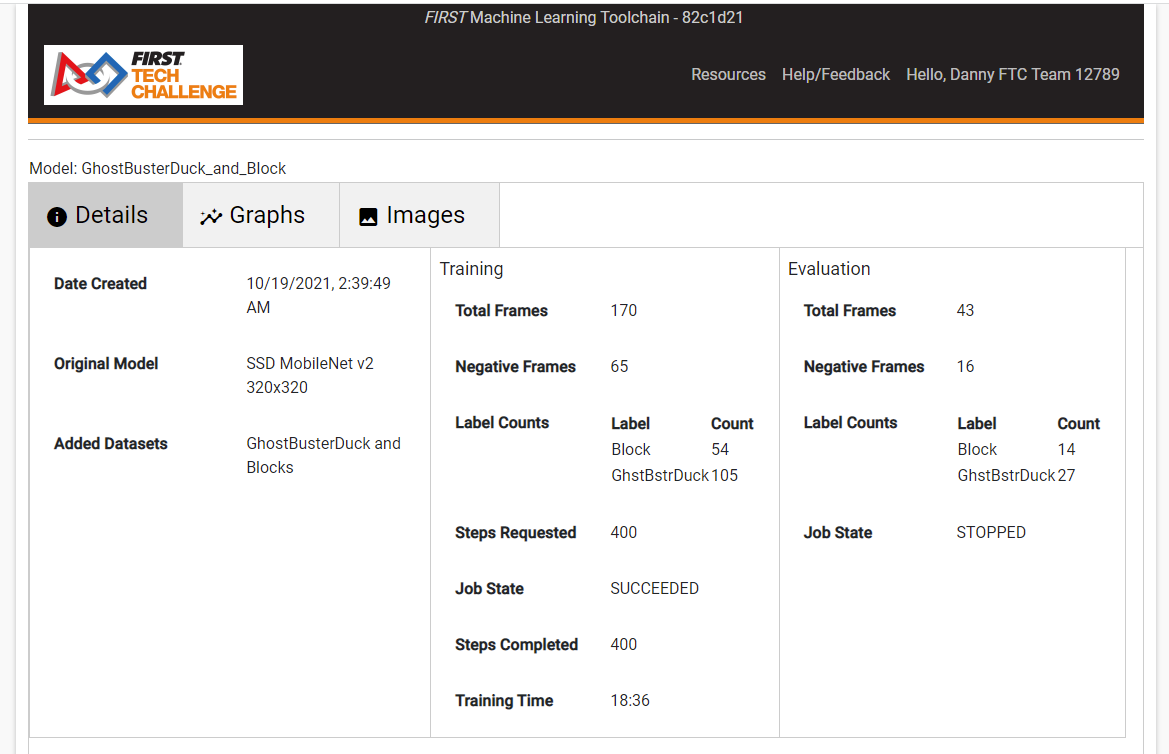
Figure 11: Viewing the model details in the “Monitor Training” viewer
The Monitor Training Viewer, seen in Figure 11, has 3 separate “tabs” within the viewer.
Details – Here the general training details are listed for the model. This includes which datasets were used to create the model, which model originated this model, training details, and evaluation details. This is the default tab when the Monitor Training viewer for the model is opened.
Graphs – This provides a scrollable viewer to see the graphs of specific performance metrics (discussed above). When the Monitor Training viewer is opened, the graphs may take several seconds to load – a rotating icon will show as the metric graphs are loaded.
Images – In the Images tab, you are able to see how well the model performed on each evaluation image at each 100-step checkpoint for each of the evaluation images in your data set. When the viewer is first opened, the images may need to load; a spinning icon in the images tab will be shown while loading. An example of the Images Tab can be seen in Figure 12 below. There are two copies of the same image side by side – each image represents one evaluation image in the Dataset. The image on the right always shows the bounding box labeled by the user, and always has a 100% detection shown on the bounding box. The image on the left shows the bounding box and detection percentage as predicted by the model at a specific checkpoint. In the example 400 steps were run and the images are showing the bounding boxes and detection rate of the 400-step checkpoint. Move the slider above each image to select a different checkpoint. The images are small, but to view the images larger right-click the image you wish to view and select “Open image in new tab” to open the image at full resolution in a new tab.
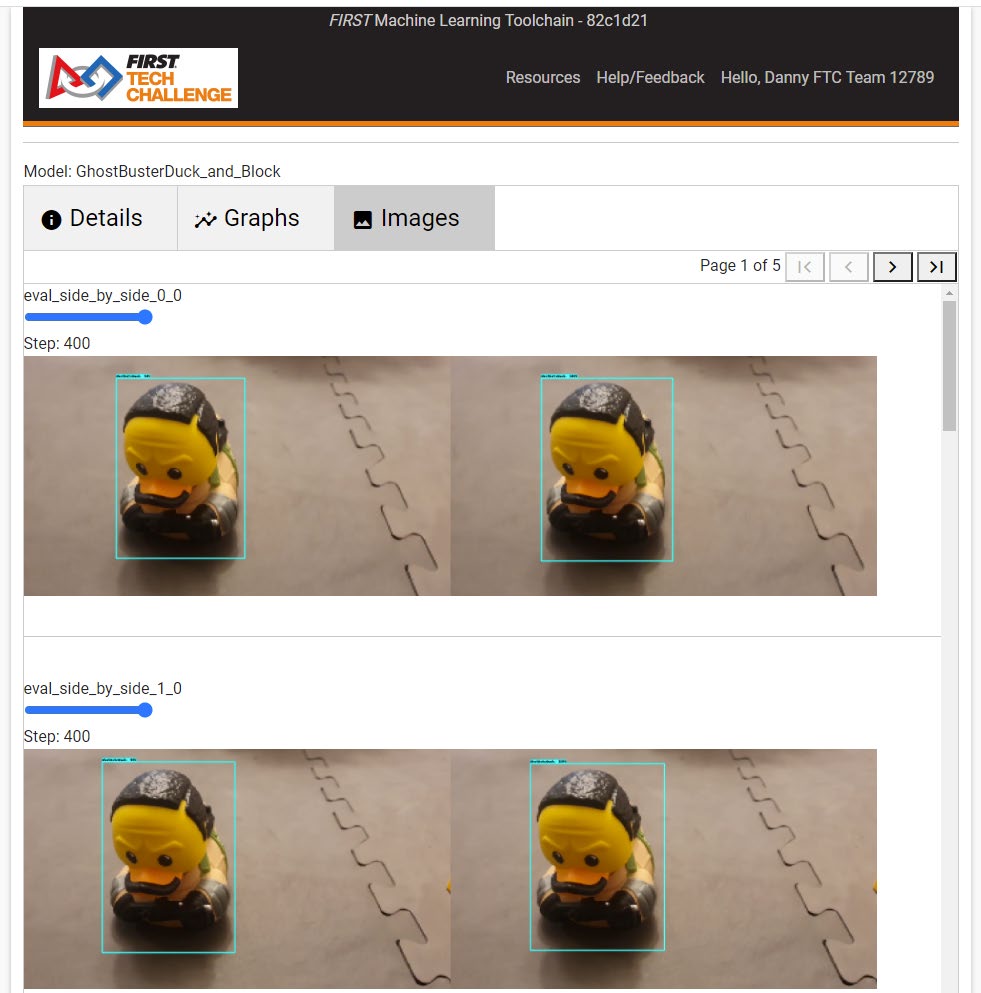
Figure 12:Viewing Training Image Performance in the Monitor Model viewer
If the images are scaled incorrectly (too large or too small), reload the page in the browser with the Images tab opened until the tab has completely loaded. Images are scaled based on the size of the browser during page load, and sometimes the page size is calculated incorrectly when the Images tab isn’t selected.